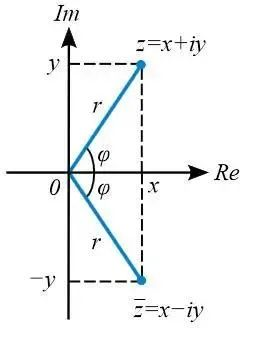
In electrical engineering, the opposition to current in a circuit is often called impedance. The unit of impedance is the ohm, commonly represented by Z, and it is a complex number:
What Is Impedance?
In electrical engineering, the opposition to current in a circuit is often called impedance. The unit of impedance is the ohm, commonly represented by Z, and it is a complex number:
Z = R + i(ωL – 1/(ωC))
Specifically, impedance can be divided into two parts: resistance (the real part) and reactance (the imaginary part).
Reactance further includes capacitive reactance and inductive reactance. The opposition to current caused by capacitance is called capacitive reactance, and the opposition to current caused by inductance is called inductive reactance.
2
Ideal Model of Impedance Matching
Most RF engineers have encountered the problem of impedance matching. In simple terms, the purpose of impedance matching is to ensure effective transmission of a signal or energy from the “signal source” to the “load.”
The most ideal model, of course, is that the output impedance at the source end is 50 ohms, the impedance of the transmission line is 50 ohms, and the input impedance at the load end is also 50 ohms—maintaining 50 ohms all the way through. This is the most ideal case.
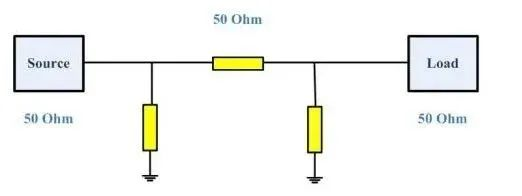
However, in reality, the source-end impedance will not be 50 ohms, and the load-end impedance will not be 50 ohms either. In this case, several impedance matching circuits are required.
The matching circuit is composed of inductors and capacitors. At this time, we need to use capacitors and inductors to debug the impedance matching circuit in order to achieve optimal RF performance.
3
Methods of Impedance Matching
There are mainly two methods of impedance matching: one is changing the impedance, and the other is adjusting the transmission line.
Changing the impedance means adjusting the load impedance value through series and parallel connection of capacitors, inductors, and the load, so as to achieve matching between the source and load impedances.
Adjusting the transmission line means increasing the distance between the source and the load, and using capacitors and inductors to adjust the impedance to zero.
At this time, the signal will not be reflected, and the energy can be absorbed by the load.
In high-speed PCB routing, the trace impedance of digital signals is generally designed to be 50 ohms. Generally, coaxial cable is specified as 50 ohms for baseband and 75 ohms for broadband, and twisted pair (differential) is 85–100 ohms.
4
Application of the Smith Chart in RF Matching Circuit Debugging
The Smith chart can reflect the following information: impedance parameter Z, admittance parameter Y, quality factor Q, reflection coefficient, standing wave ratio, noise figure, gain, stability factor, power, efficiency, frequency information, and other parameters.
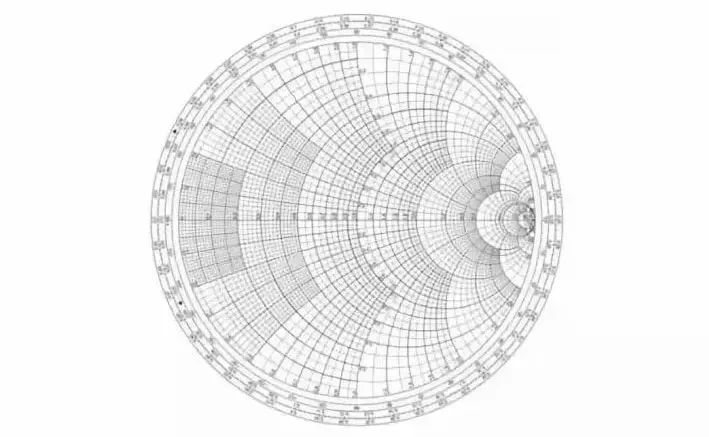
Are you confused? Let’s look at the impedance chart instead:
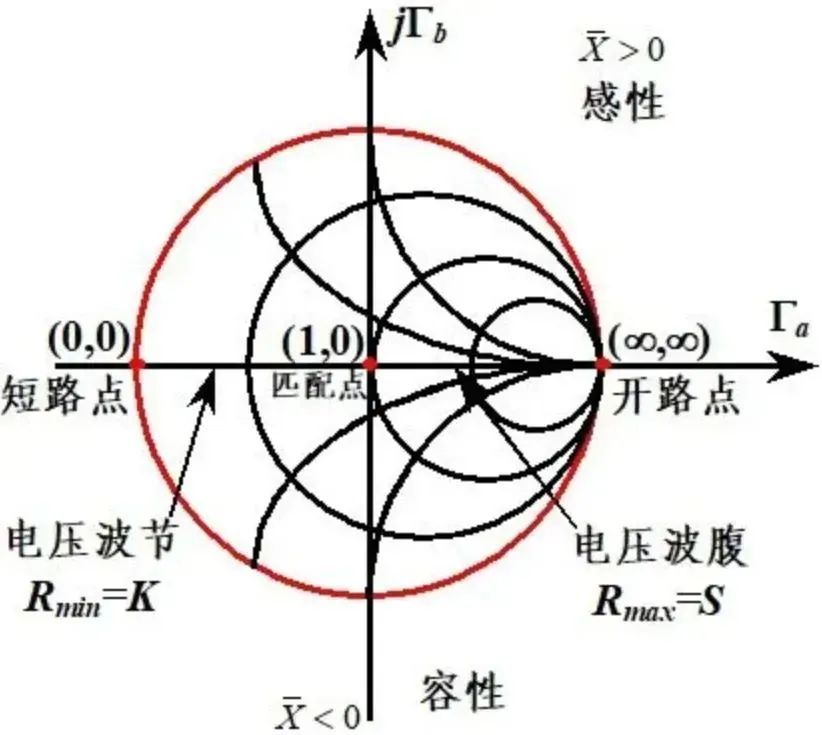
The construction principle of the impedance chart is to use the one-to-one correspondence between input impedance and voltage reflection coefficient to represent the normalized input impedance in the polar coordinate system of the reflection coefficient. Its characteristics can be summarized as follows:
The upper half-circle impedance is inductive reactance, and the lower half-circle impedance is capacitive reactance;
The real axis is pure resistance, and the unit circle is pure reactance;
The right half-axis of the real axis consists of voltage antinodes (except the open-circuit point), and the left half-axis consists of voltage nodes (except the short-circuit point);
The matching point (1, 0), the open-circuit point (∞, ∞), and the short-circuit point (0, 0);
Two special circles: the largest one is the pure reactance circle, and the one tangent to the imaginary axis is the matching circle;
Two rotation directions: counterclockwise means moving toward the load, and clockwise means moving toward the wave source.
The admittance chart and the impedance chart are centrally symmetric to each other. The same chart can be used either as an impedance chart or as an admittance chart. However, during each operation, if it is used as an impedance chart, it cannot be used as an admittance chart.
In the Smith chart, some very interesting characteristics can be represented:
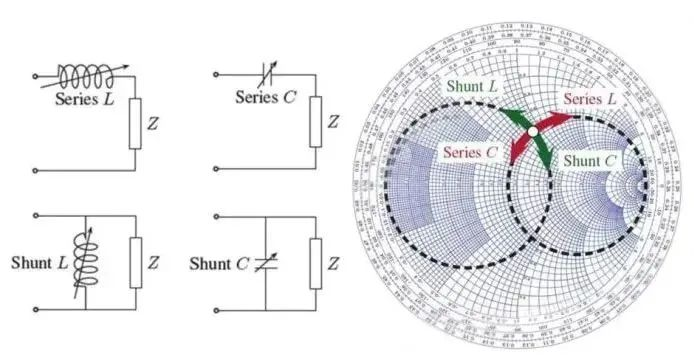
By connecting a variable inductor/capacitor in series or parallel before the load, as shown in the four diagrams on the left of the figure below, several curves on the right side of the Smith chart will be obtained.
Corresponding to the Smith impedance chart and admittance chart, their movement loci are as follows:
When using the Smith impedance chart, a series inductor rotates clockwise, and a series capacitor rotates counterclockwise;
When using the Smith admittance chart, a parallel inductor rotates counterclockwise, and a parallel capacitor rotates clockwise.
About Maxipcb
Maxipcb empowers innovators to turn cutting-edge technologies into reality.We offer one-stop solutions for design, simulation, testing, PCB manufacturing, component procurement and SMT assembly, enabling efficient development, rapid deployment and risk control across the full product lifecycle.
Serving the world in communications, industrial automation, aerospace, automotive, semiconductor and beyond, we build a safer, more connected future together.
