An eye diagram is formed by the persistence effect of an oscilloscope, which overlaps each symbol waveform obtained by scanning to create the pattern resembling a human eye.
An eye diagram is formed by the persistence effect of an oscilloscope, which overlaps each symbol waveform obtained by scanning to create the pattern resembling a human eye.
This article will explain what an eye diagram on a PCB is, how it is formed, what information it contains, and how to judge signal quality based on the characteristics of an eye diagram.
To understand an oscilloscope eye diagram, you need to master the following four key points:
1. What is an Eye Diagram?
An eye diagram is a pattern displayed by the accumulation of a series of digital signals on an oscilloscope. It contains abundant information—intersymbol interference and the effects of noise can be observed from it, reflecting the overall characteristics of digital signals and thus enabling the evaluation of system performance. Therefore, eye diagram analysis is the core of signal integrity analysis for high-speed interconnection systems. In addition, this pattern can be used to adjust the characteristics of the receiving filter to reduce intersymbol interference and improve the transmission performance of the system.
An eye diagram is obtained by connecting an oscilloscope to the output end of a receiving filter, then adjusting the oscilloscope's scanning period to synchronize its horizontal scanning period with the period of the received symbols—the pattern seen on the oscilloscope screen at this time is called an eye diagram. An oscilloscope typically measures the waveform of a few bits or a specific time period, reflecting more detailed information, while an eye diagram reflects the overall characteristics of all digital signals transmitted on a link.
The method for observing an eye diagram is as follows: Connect an oscilloscope to the output end of a receiving filter, adjust the oscilloscope's scanning period to synchronize its horizontal scanning period with the period of the received symbols. The resulting pattern on the oscilloscope screen resembles a human eye, hence the name "eye diagram". The effects of intersymbol interference and noise can be observed from the eye diagram to evaluate system performance, and it can also be used to tune the receiving filter to reduce intersymbol interference and optimize transmission performance.
2. How is an Eye Diagram Formed?
For digital signals, the transitions between high and low levels can form a variety of sequence combinations. Taking 3 bits as an example, there are 8 combinations from 000 to 111. An eye diagram is formed by aligning a sufficient number of such sequences at a single reference point in the time domain and then superimposing their waveforms
.
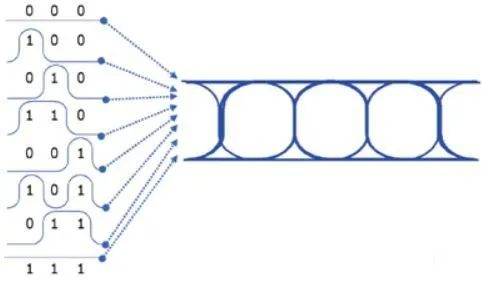
For test instruments, the clock signal is first recovered from the signal under test, and then the eye diagram is superimposed based on the clock reference for final display.
3. What Information is Contained in an Eye Diagram?
For a real eye diagram, basic level transition parameters of the digital waveform can be directly observed, including:
- Rise Time
- Fall Time
- Overshoot
- Undershoot
- Threshold/Crossing Percent
Key Parameter Definitions
- Rise Time: The time interval between the instants when the instantaneous value of a pulse signal first reaches the specified lower and upper limits. Unless otherwise specified, the lower and upper limits are set to 10% and 90% of the peak pulse amplitude, respectively.
- Fall Time: The time interval for the pulse signal to drop from 90% to 10% of its peak amplitude.
- Overshoot: Also known as overshooting, it refers to the first peak or trough exceeding the set voltage. It mainly appears as a sharp pulse and can cause the failure of circuit components.
- Undershoot: Refers to the subsequent trough or peak after overshoot. Excessive overshoot can activate protection diodes, leading to premature failure; excessive undershoot can cause false clock signals or data errors.
- Threshold/Crossing Percent: The minimum receiving level that a receiver can achieve when the system transmission characteristic is worse than a specific bit error rate.
4. How to Judge Signal Quality Based on an Eye Diagram?
A signal can never maintain an exactly consistent voltage value for high and low levels, nor can it ensure that the rising and falling edges of high and low levels occur at the exact same moment every time. Due to the superposition of multiple signals, the signal traces of the eye diagram become thick and exhibit blur.
Thus, an eye diagram also reflects the noise and jitter of a signal:
- On the vertical voltage axis: Reflected as Voltage Noise
- On the horizontal time axis: Reflected as Time Domain Jitter
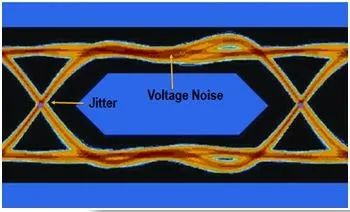
In the presence of noise, the noise is superimposed on the signal, making the traces of the observed eye diagram blurry. If intersymbol interference exists at the same time, the "eye" will open even narrower. In general, the wider the eye opens and the higher the eye height, the better the signal quality.
Signal simulation can be used to obtain the eye diagram, and then signal quality is judged based on its characteristics. If the eye diagram performance is poor, hardware or PCB design can be adjusted to increase the eye height, ensuring the signal quality of the manufactured products.
About Maxipcb
Maxipcb empowers innovators to turn cutting-edge technologies into reality.
We offer one-stop solutions for design, simulation, testing, PCB manufacturing, component procurement and SMT assembly, enabling efficient development, rapid deployment and risk control across the full product lifecycle.Serving the world in communications, industrial automation, aerospace, automotive, semiconductor and beyond, we build a safer, more connected future together.


